The Invocation Tree view shows a top-down call tree that represents how XSLT instructions or XQuery expressions are processed.
Figure: Invocation Tree View
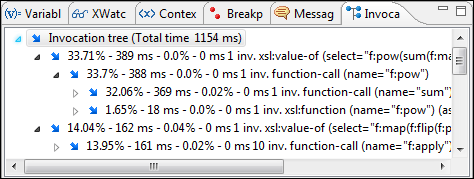
The entries in the invocation tree include a few possible icons that indicate the following:
 -
Points to a call whose inherent time is insignificant compared to its total time.
-
Points to a call whose inherent time is insignificant compared to its total time. - Points
to a call whose inherent time is significant compared to its total time (greater than 1/3rd
of its total time).
- Points
to a call whose inherent time is significant compared to its total time (greater than 1/3rd
of its total time).
Every entry in the invocation tree includes textual information that depends on the XSLT/XQuery profiler settings:
- A percentage number of the total time that is calculated with respect to either the root of the tree or the calling instruction.
- A total time measurement in milliseconds or microseconds. This is the total execution time that includes calls into other instructions.
- A percentage number of the inherent time that is calculated with respect to either the root of the tree or the calling instruction.
- An inherent time measurement in milliseconds or microseconds. This is the inherent execution time of the instruction.
- An invocation count that shows how often the instruction has been invoked on this call-path.
- An instruction name that contains also the attributes description.
